This repository contains some simple experiments I've used to help teach myself HTML, CSS, Javascript, D3, jQuery, and other libraries. Experiments are in reverse chronological order.
 10. Experimenting
with scrubbable numbers
10. Experimenting
with scrubbable numbers
 9. Draw lines on a
canvas
9. Draw lines on a
canvas 8. Draw on a
canvas
8. Draw on a
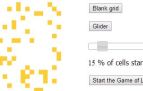
canvas 7. Programmable Game
of Life Click on cells to set and unset them. Starts
with a glider present.
7. Programmable Game
of Life Click on cells to set and unset them. Starts
with a glider present.
 6. Clickable
chessboard: A simple use of the canvas element, as well
as mouse events.
6. Clickable
chessboard: A simple use of the canvas element, as well
as mouse events.
 5. Mandelbrot set: Plotted using
D3. Plots roughly 90,000 points, each one requiring some little
effort. The points are then rendered as SVG rectangles.
Unsurprisingly, it's quite memory- and CPU-intensive, and will take a
few seconds to load. Despite this, I found myself impressed by how
quickly 2014 browsers work. Note that reloading the process will eat
up memory, so beware. Note also that the rendering can be streaky,
due to non-overlap of SVG rectangles. I've chosen the dimensions so
this doesn't happen, at least in my browser, but it's easy to alter
the dimensions so that's not true. The cause is an architectural
mistake on my part: my program computes the function in the underlying
mathematical space — i.e., the "natural" co-ordinates used to
explain the Mandelbrot set — and then transforms to screen
co-ordinates. It would have been better to start from screen co-ords,
transform to the mathematical space, compute the function, and
transform back. That would make it easier to fit the rectangles snugly
up against one another. This is worth keeping in mind for any D3
visualization whose aim is to output shapes which fit snugly up
against one another. For most visualizations it shouldn't be an
issue.
5. Mandelbrot set: Plotted using
D3. Plots roughly 90,000 points, each one requiring some little
effort. The points are then rendered as SVG rectangles.
Unsurprisingly, it's quite memory- and CPU-intensive, and will take a
few seconds to load. Despite this, I found myself impressed by how
quickly 2014 browsers work. Note that reloading the process will eat
up memory, so beware. Note also that the rendering can be streaky,
due to non-overlap of SVG rectangles. I've chosen the dimensions so
this doesn't happen, at least in my browser, but it's easy to alter
the dimensions so that's not true. The cause is an architectural
mistake on my part: my program computes the function in the underlying
mathematical space — i.e., the "natural" co-ordinates used to
explain the Mandelbrot set — and then transforms to screen
co-ordinates. It would have been better to start from screen co-ords,
transform to the mathematical space, compute the function, and
transform back. That would make it easier to fit the rectangles snugly
up against one another. This is worth keeping in mind for any D3
visualization whose aim is to output shapes which fit snugly up
against one another. For most visualizations it shouldn't be an
issue.
 4. First-person
engine: I worked through
Hunter
Loftis's great tutorial. The credit is his, apart from any
mistakes I've introduced!
4. First-person
engine: I worked through
Hunter
Loftis's great tutorial. The credit is his, apart from any
mistakes I've introduced!
 3.
Calculator: Handles simple calculations, not well tested,
and doesn't handle exceptions properly. An exercise in playing with
buttons.
3.
Calculator: Handles simple calculations, not well tested,
and doesn't handle exceptions properly. An exercise in playing with
buttons.
 2. Game of
Life: uses jQuery and jQuery UI to add a slider plus a
few other elements.
2. Game of
Life: uses jQuery and jQuery UI to add a slider plus a
few other elements.
1. Game of
Life: implemented using D3.